
프로메테우스(Prometheus)란?
시간이 지남에 따라 추이가 변하는 데이터를 메트릭(Metric)이라고 한다. CPU사용량, 메모리 사용량 등이 메트릭에 해당한다. SpringBoot는 Metric 수집을 마이크로미터(MicroMeter) 모듈을 내장한 엑츄에이터가 담당한다.
그런데 문제가 있다.
메트릭은 시간이 흐를수록 계속 쌓이게 된다. Application의 메모리만으로는 증가하는 메트릭 데이터를 모두 커버할 수 없다. 그래서 메트릭 전용 외부 DB를 두는데, 그것이 프로메테우스(Prometheus)이다.

프로메테우스는 마이크로미터가 수집한 메트릭 데이터를 일정시간 간격으로 PULL하여 DB에 수집한다. 이때, MicroMeter Prometheus 구현체가 필요하다. 마이크로미터는 수집한 메트릭을 JSON 방식으로 전달하지만 프로메테우스는 JSON 데이터를 처리하지 못한다. 그래서 마이크로미터와 프로메테우스 사이에는 JSON 데이터를 프로메테우스가 처리가능한 데이터 형식으로 변환하는 구현체가 필요하다. 그것이 MicroMeter Prometheus 구현체이다.
그럼 SpringBoot Application과 프로메테우스를 연동해보자.
연동
1. 프로메테우스 설치
프로메테우스를 설치해보자.
Download | Prometheus
An open-source monitoring system with a dimensional data model, flexible query language, efficient time series database and modern alerting approach.
prometheus.io
내 PC는 MacOS이므로 darwin 버전을 선택했다.
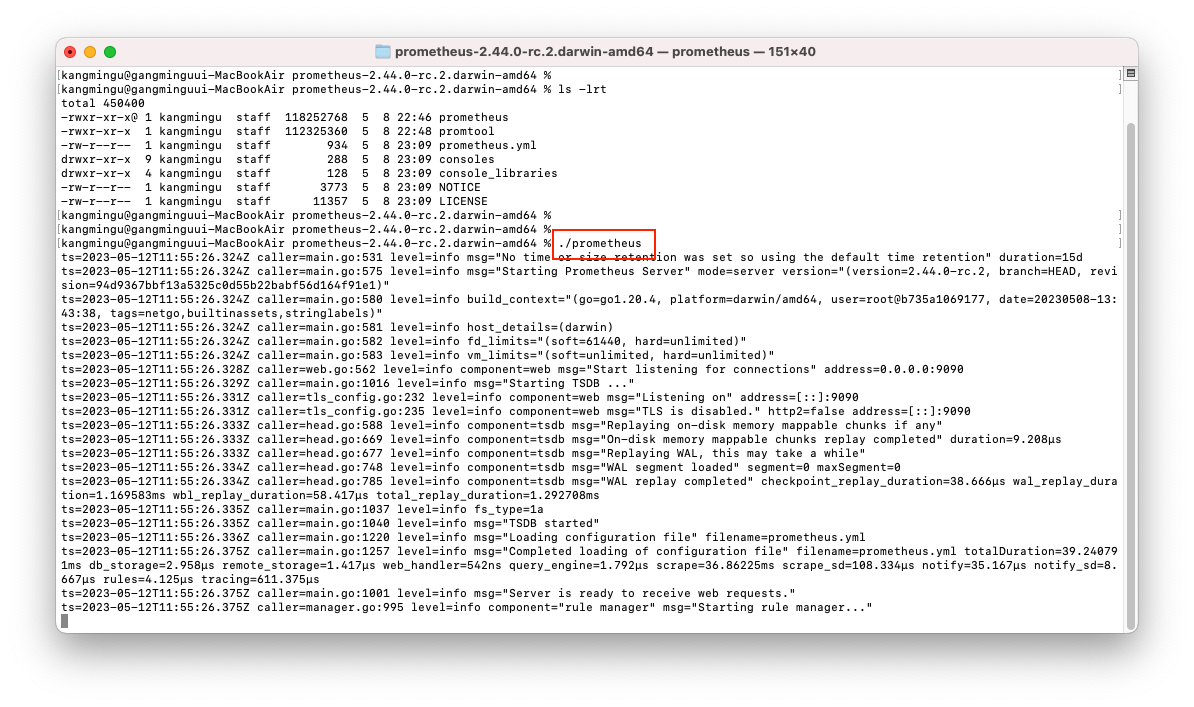
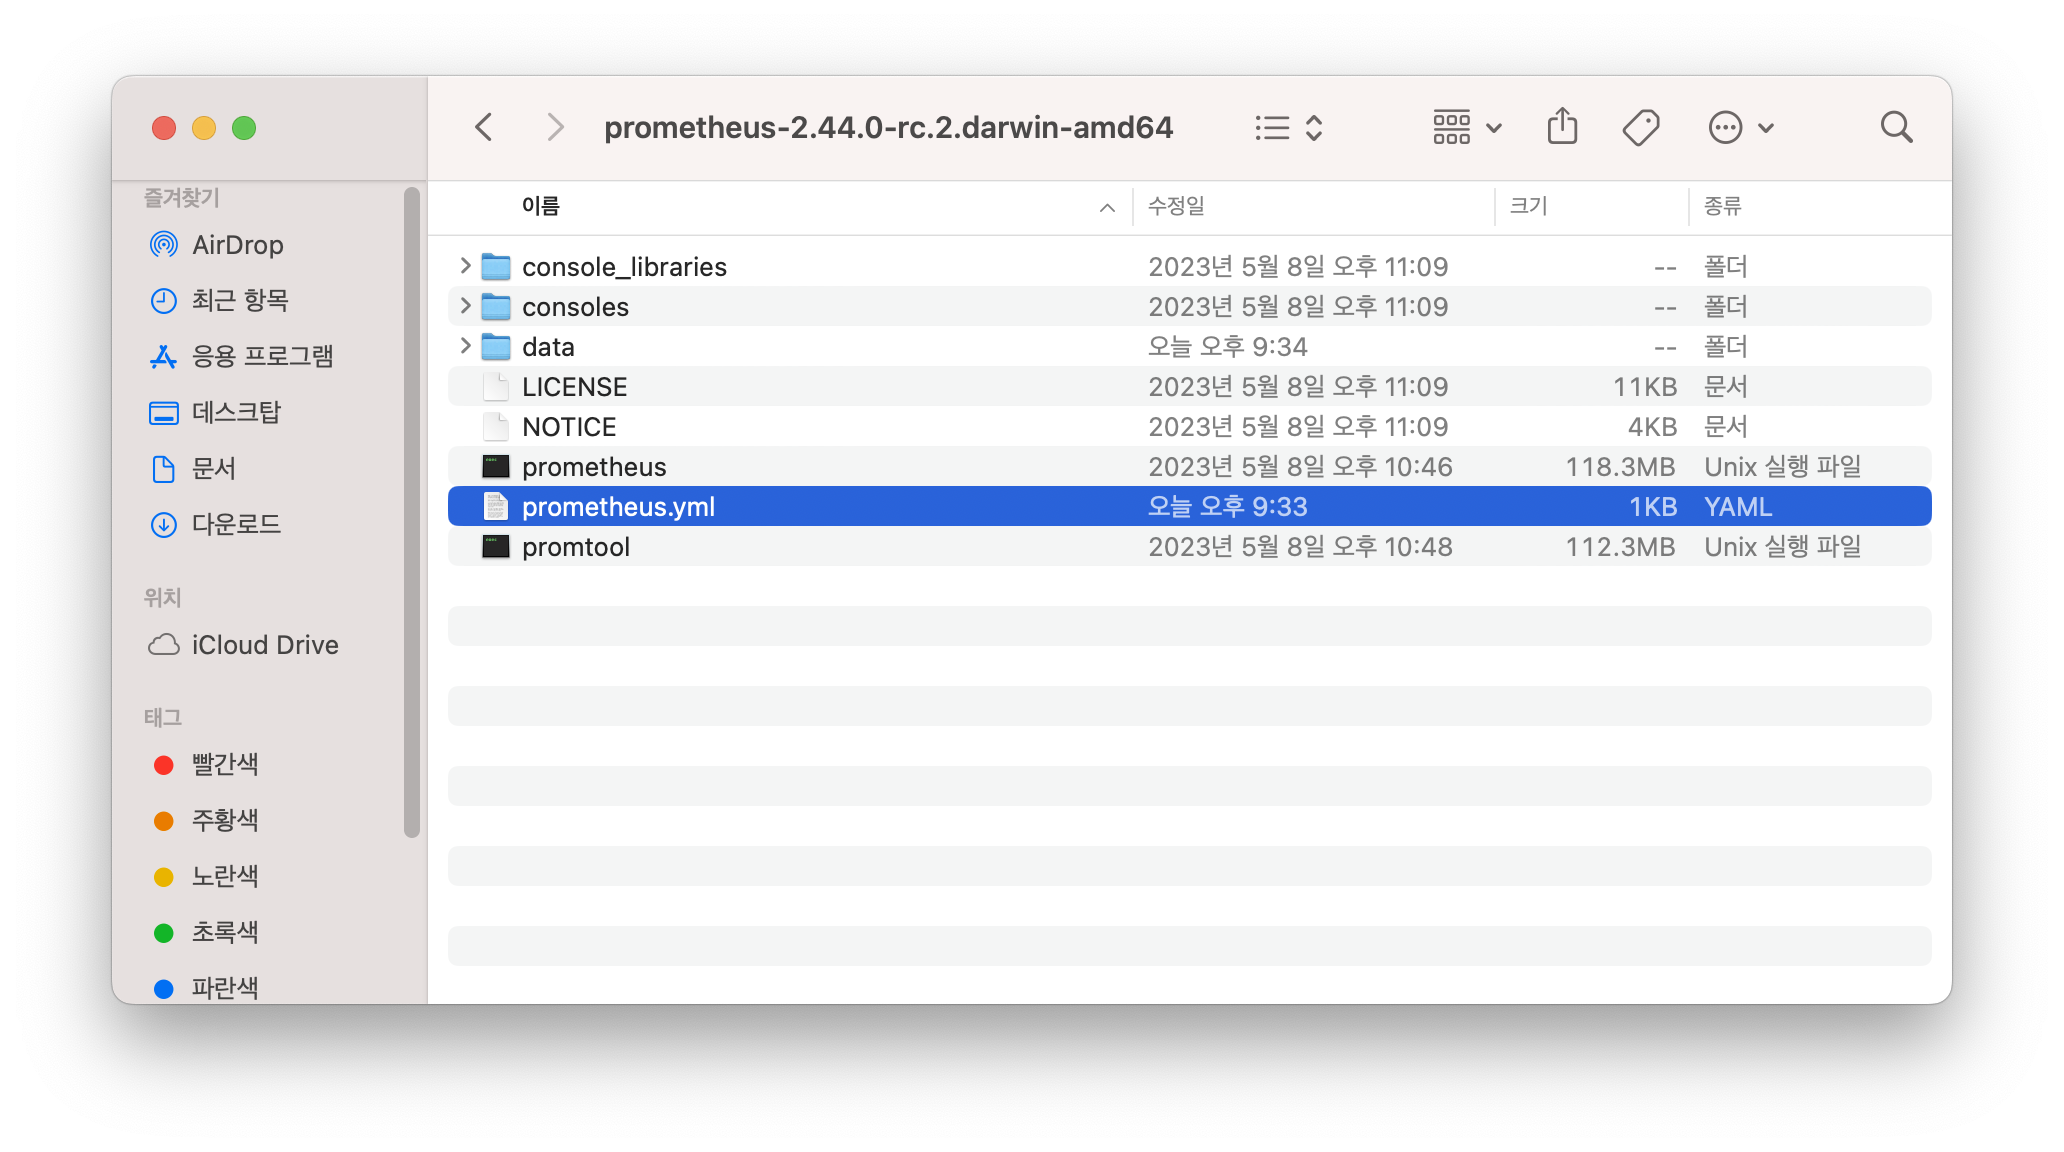
설치하고 터미널을 열어 설치폴더로 이동한 뒤 프로메테우스 서버를 실행한다.
명령어 : ./prometheus
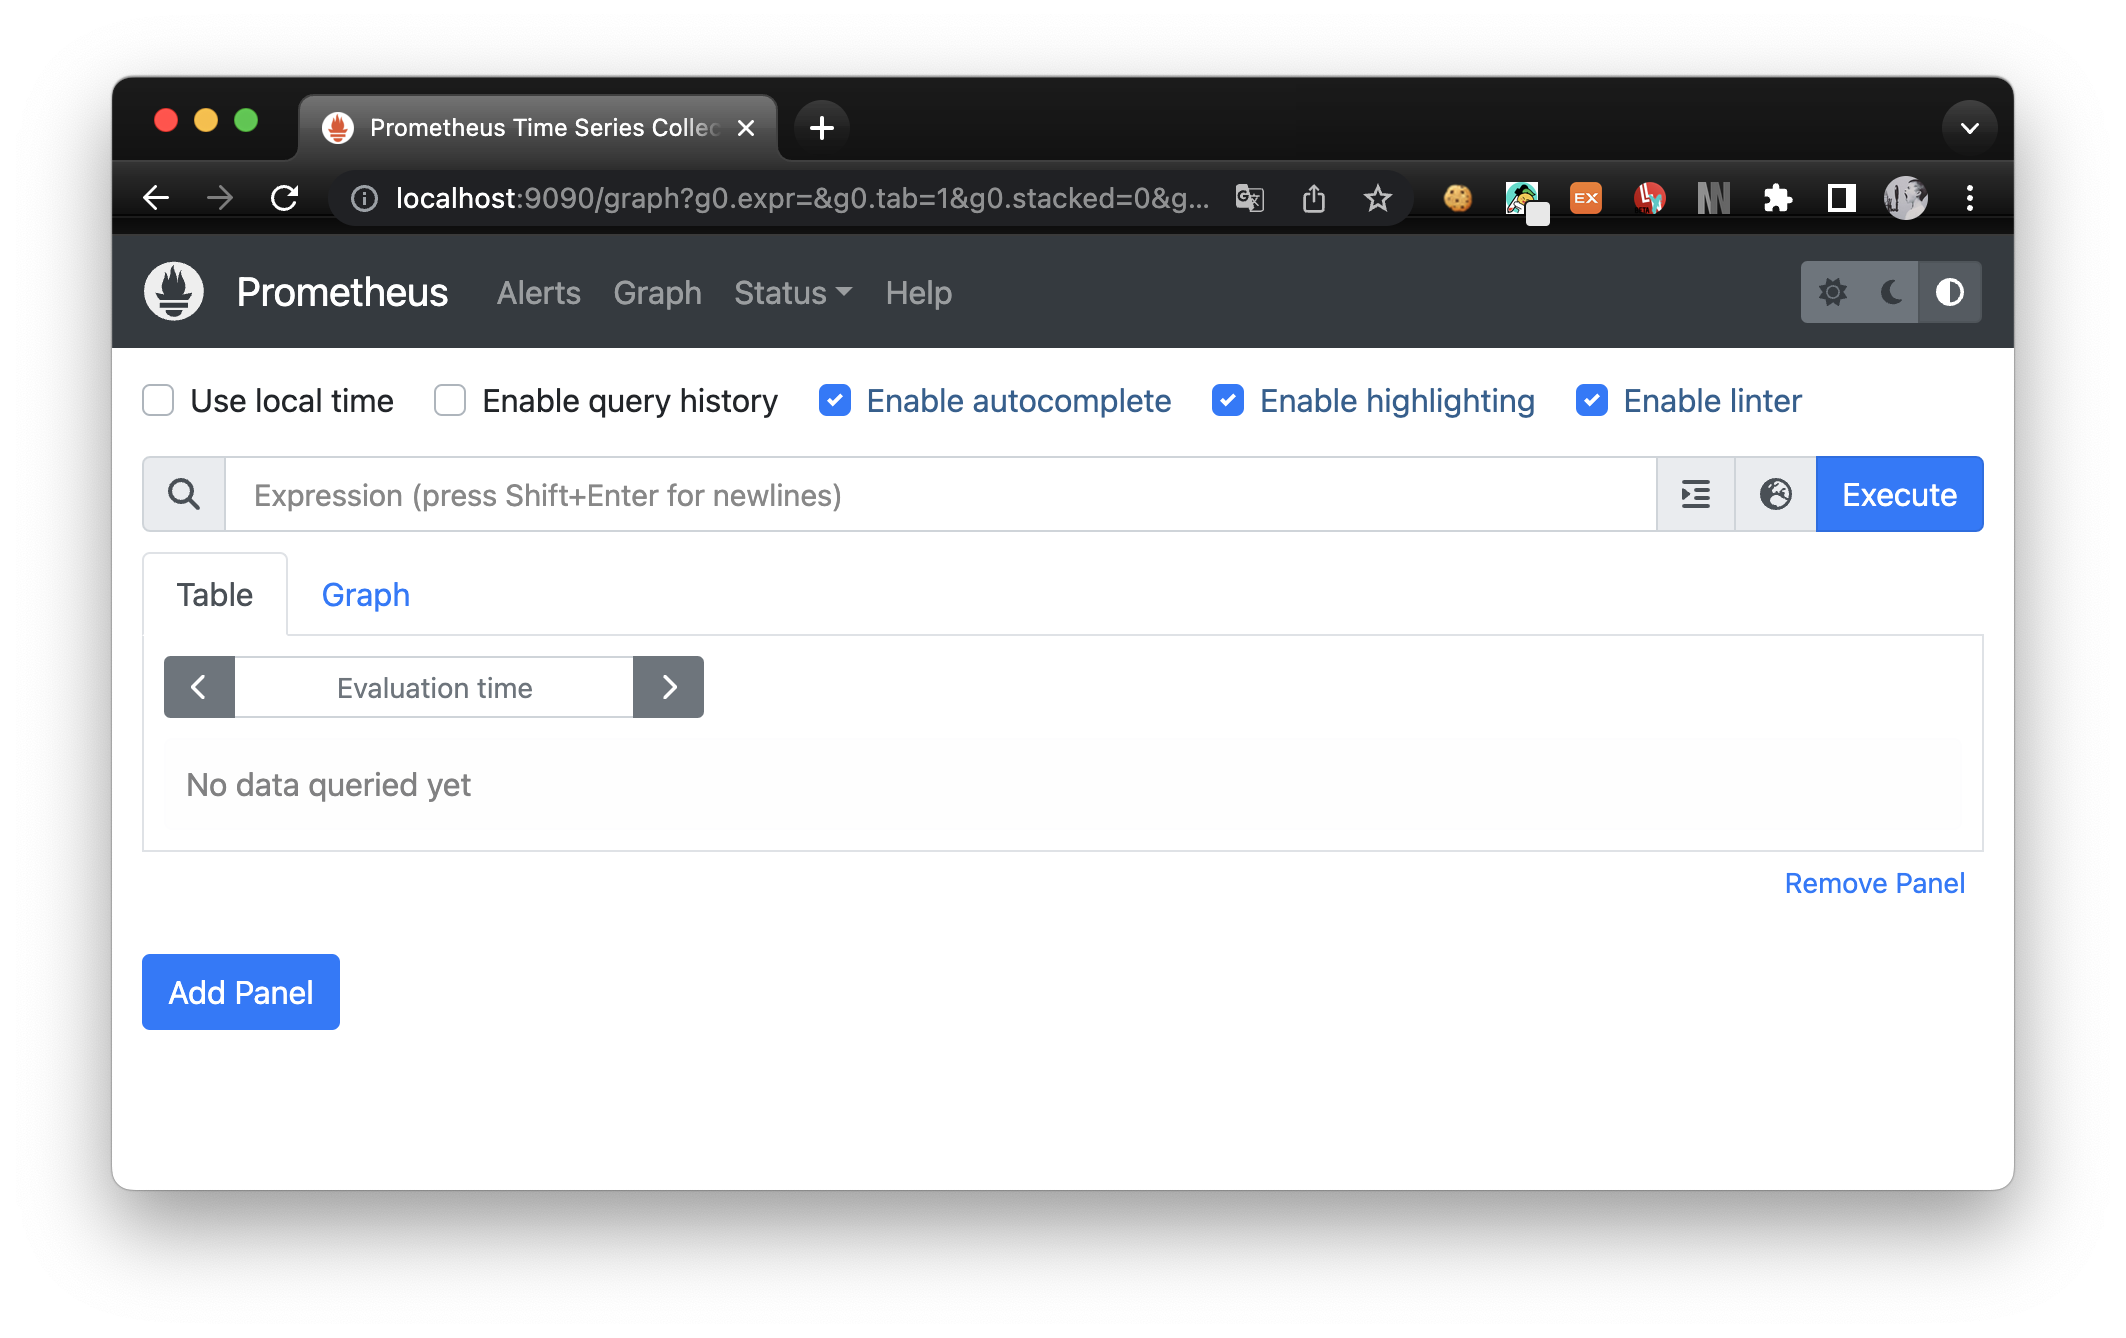
브라우저를 열고 localhost:9090으로 프로메테우스 화면을 열어준다.
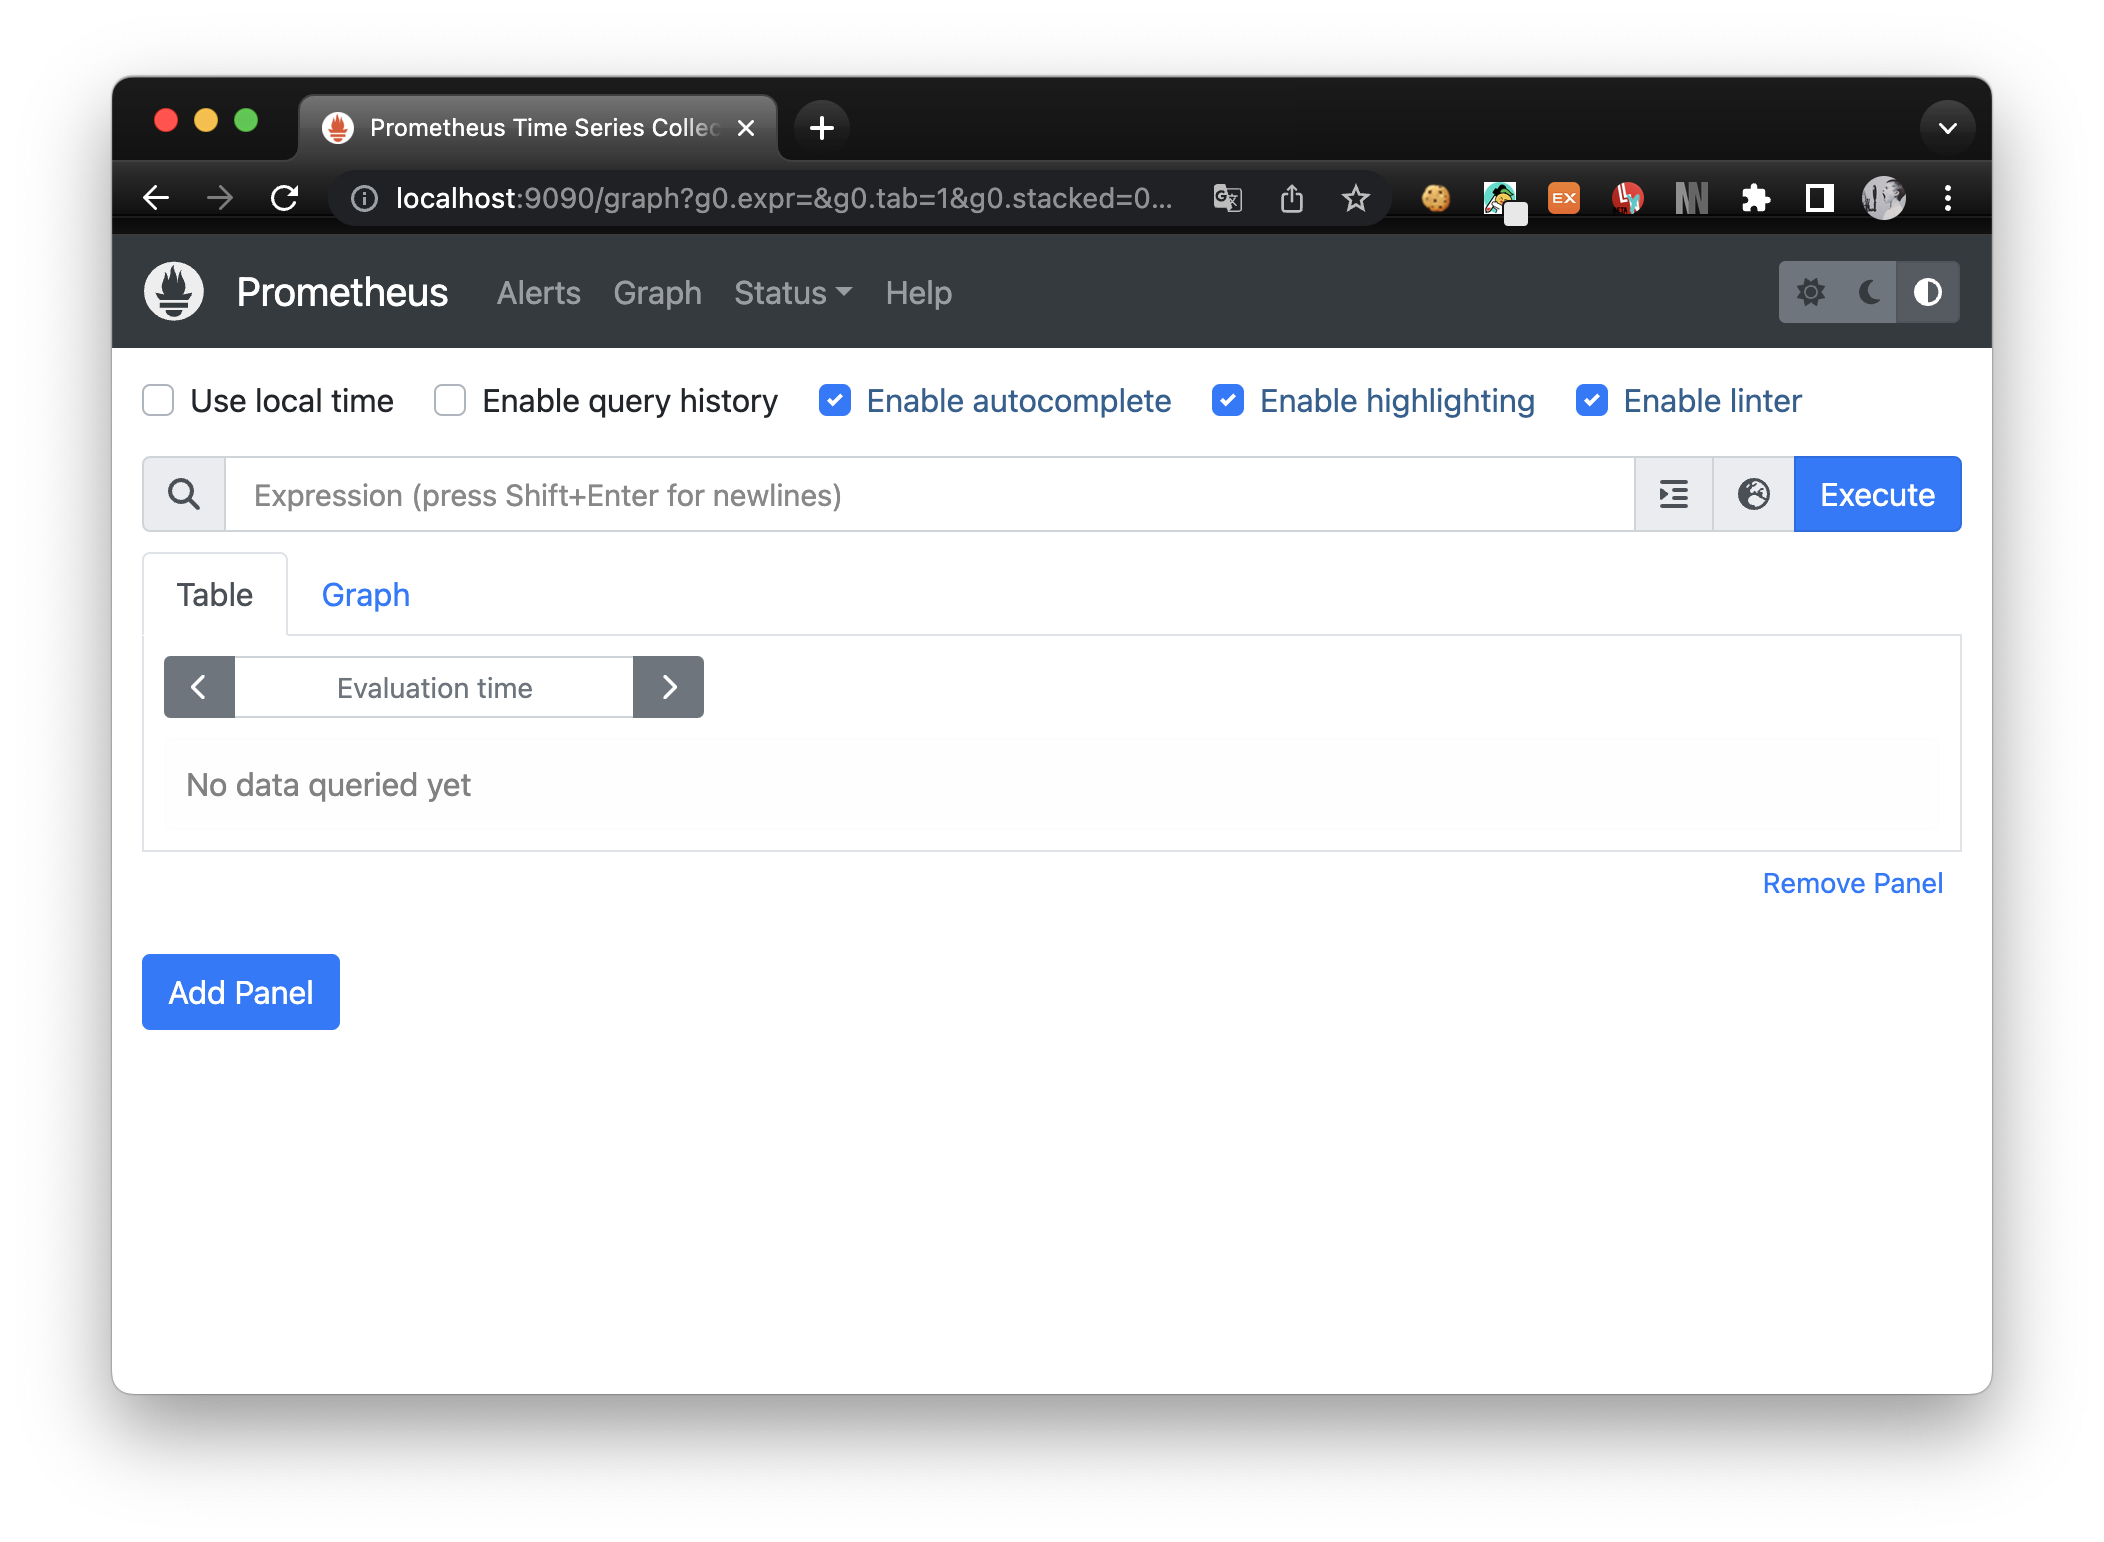
해당 화면이 열리면 정상적으로 프로메테우스 서버가 실행된 것이다.
2. 스프링부트 프로젝트 생성하기 ( Actuator + 마이크로미터 프로메테우스 구현체 )

스프링 부트 프로젝트 생성시, Actuator와 Prometheus를 디펜던시로 추가한다.
build.gradle
dependencies {
	implementation 'org.springframework.boot:spring-boot-starter-web'
	runtimeOnly 'io.micrometer:micrometer-registry-prometheus' // 마이크로미터 프로메테우스 구현체
	implementation 'org.springframework.boot:spring-boot-starter-actuator' // 엑츄에이터
	compileOnly 'org.projectlombok:lombok'
	annotationProcessor 'org.projectlombok:lombok'

	testImplementation 'org.springframework.boot:spring-boot-starter-test'
}
프로젝트를 열어, build.gradle를 확인하면 위와 같다. prometheus와 actuator 디펜던시가 추가되었음을 확인할 수 있다.
application.yml
management:
  endpoints:
    web:
      exposure:
        include: "*"
actuator는 민간한 정보를 포함하고 있기에 설정파일에 데이터 노출설정을 해야한다.
management.endpoints.web.exposure.include=* 로 설정하여 모든 데이터가 노출되도록 해놓았다.
3. 프로젝트 실행하여 메트릭 정보 확인하기
- 마이크로미터가 수집한 메트릭 데이터 (JSON)
URL : http://localhost:8080/actuator/metrics
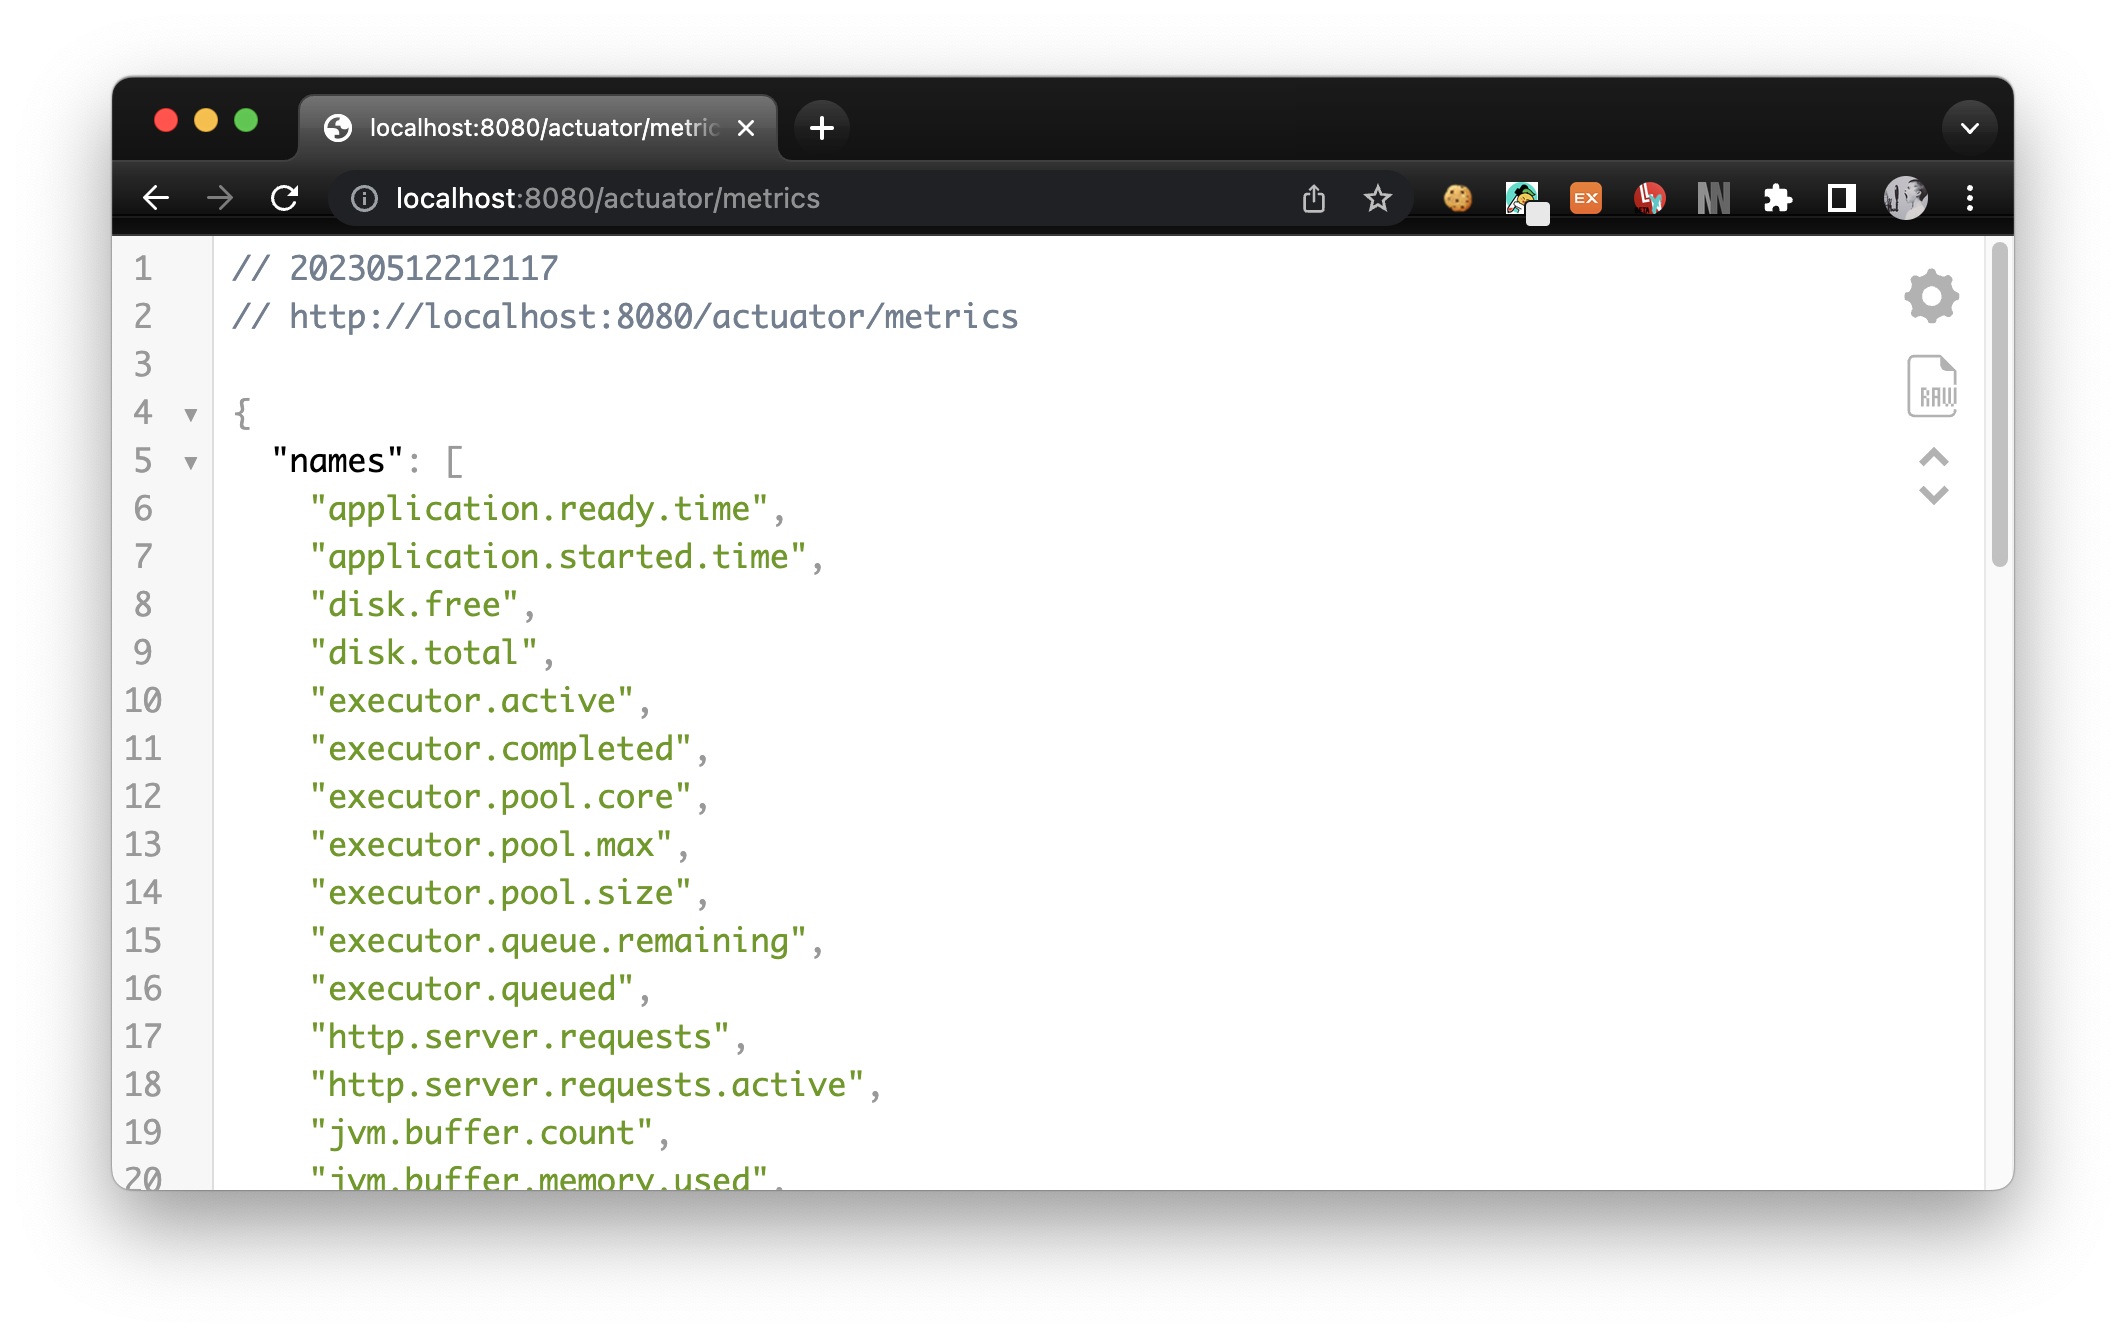
엑츄에이터 라이브러리가 제공하는 메트릭 데이터이다.
메트릭은 엑츄에이터에 내장된 마이크로미터에 의해 수집되고 JSON 방식으로 표현된다.
- 프로메테우스 데이터 포맷의 메트릭 데이터
URL : http://localhost:8080/actuator/prometheus
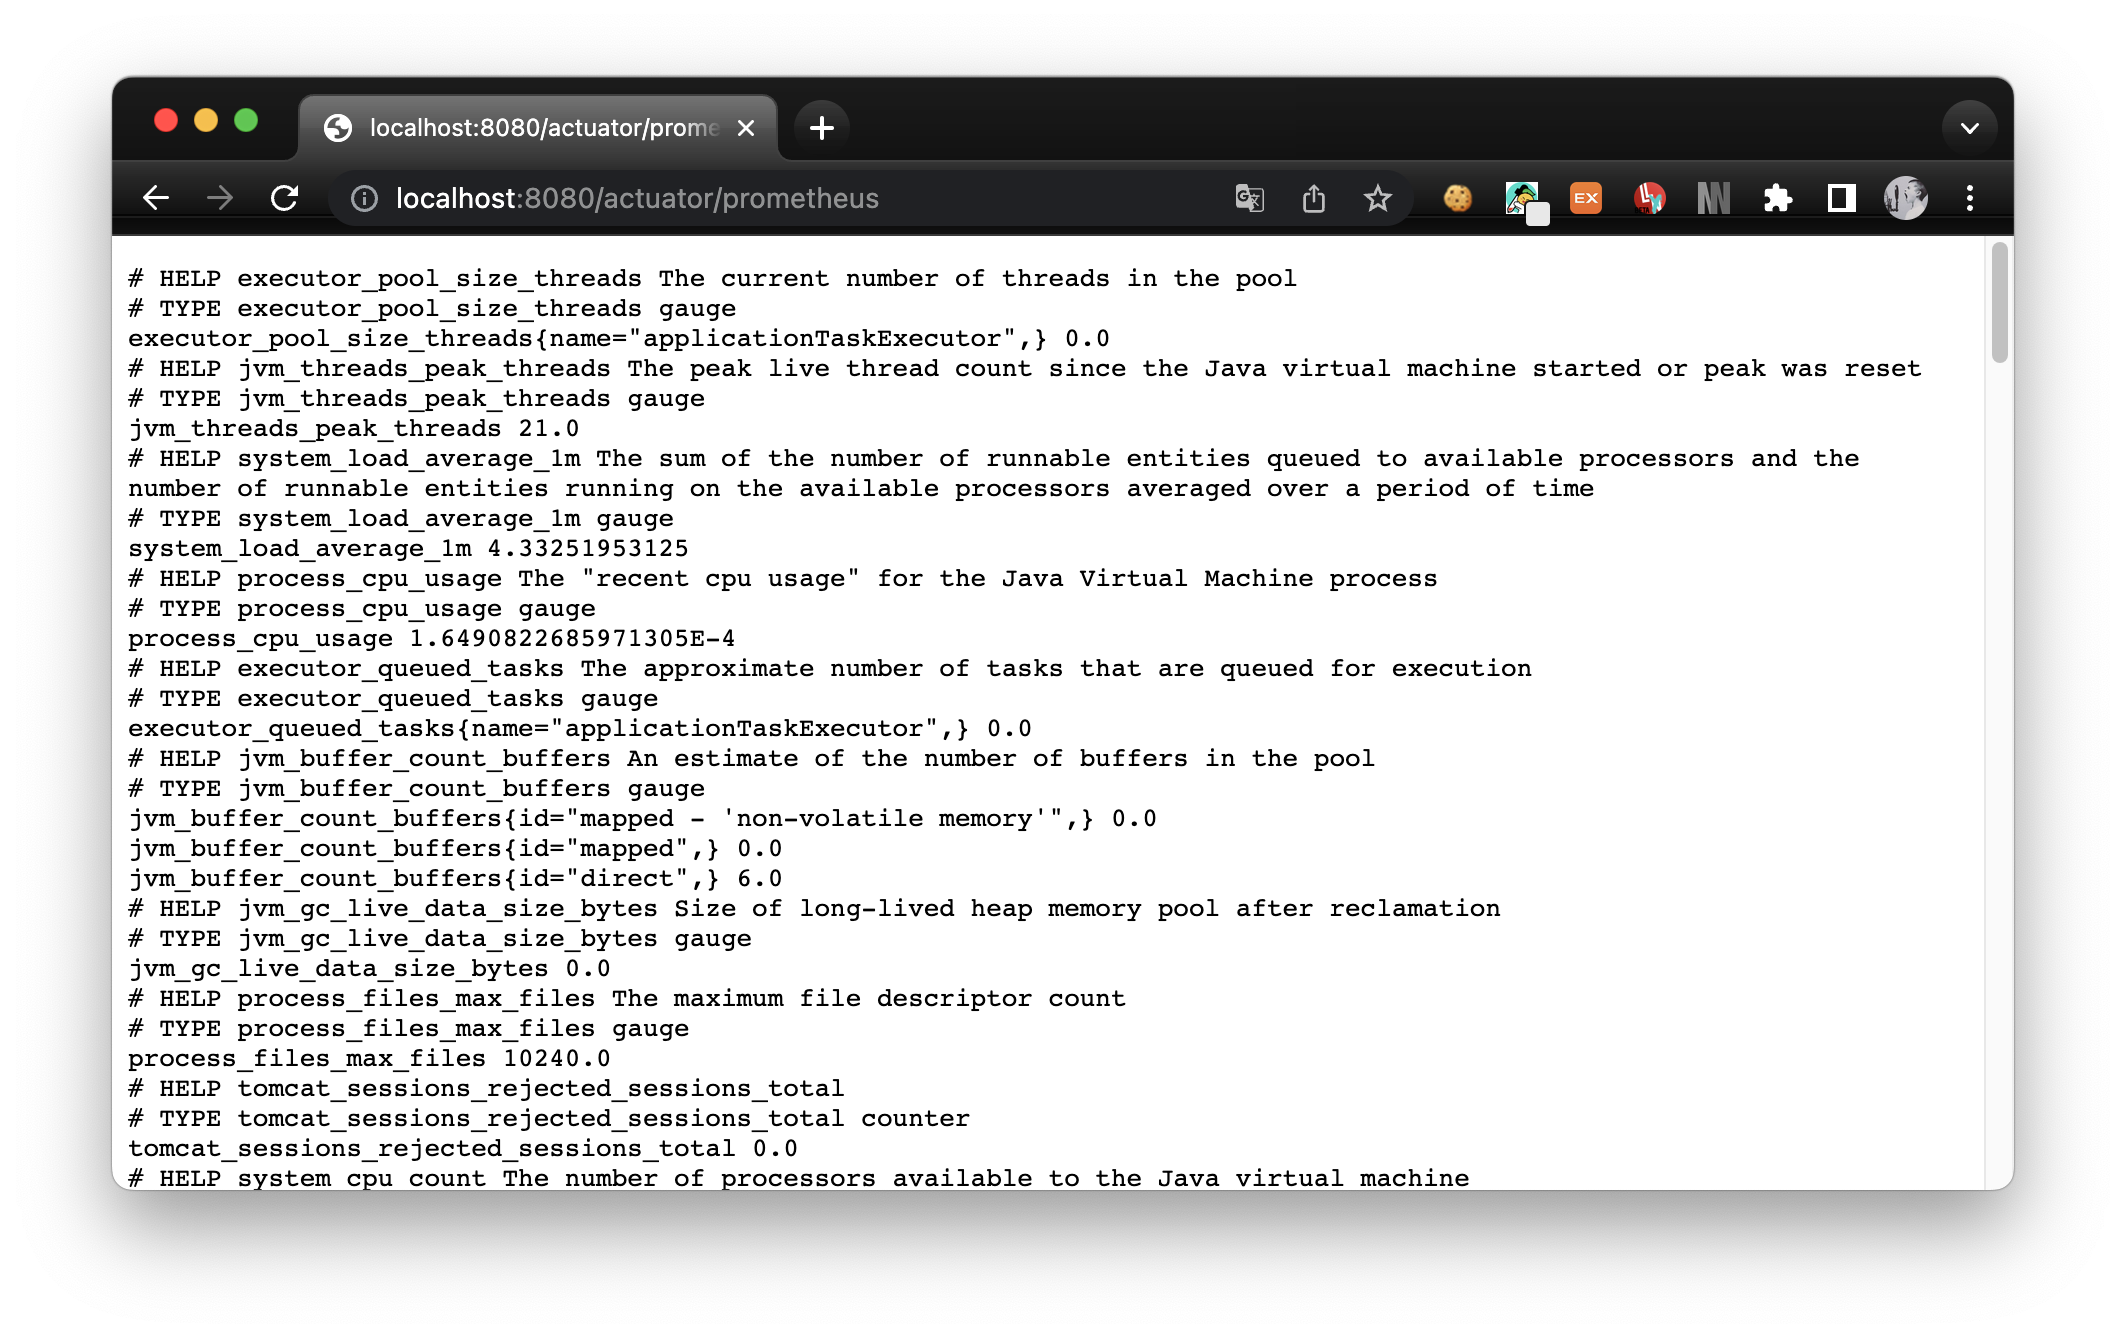
마이크로미터 프로메테우스 구현체를 디펜던시로 추가했기에 메트릭 데이터를 프로메테우스 포맷으로 변형시킬 수 있다.
프로메테우스는 해당 URL에 접근하여 메트릭 데이터를 PULL 한다.
4. 프로메테우스로 데이터 가져오기
프로메테우스가 http://localhost:8080/actuator/prometheus 경로를 바라볼 수 있도록 설정을 바꾸어야 한다.
prometheus.yml 파일을 열어 설정을 추가한다.
  - job_name: "spring-actuator"
    metrics_path: '/actuator/prometheus'
    scrape_interval: 1s
    static_configs:
      - targets: ['localhost:8080']
위 설정을 yml 파일 가장 아래에 추가한다. ( 띄어쓰기 주의! ) scrape_interval를 1s, 1초로 설정하였다. 프로메테우스는 path 경로의 메트릭 데이터에 1초마다 접근하여 메트릭 데이터를 수집해간다.
prometheus.yml
# my global config
global:
  scrape_interval: 15s # Set the scrape interval to every 15 seconds. Default is every 1 minute.
  evaluation_interval: 15s # Evaluate rules every 15 seconds. The default is every 1 minute.
  # scrape_timeout is set to the global default (10s).

# Alertmanager configuration
alerting:
  alertmanagers:
    - static_configs:
        - targets:
          # - alertmanager:9093

# Load rules once and periodically evaluate them according to the global 'evaluation_interval'.
rule_files:
  # - "first_rules.yml"
  # - "second_rules.yml"

# A scrape configuration containing exactly one endpoint to scrape:
# Here it's Prometheus itself.
scrape_configs:
  # The job name is added as a label `job=<job_name>` to any timeseries scraped from this config.
  - job_name: "prometheus"

    # metrics_path defaults to '/metrics'
    # scheme defaults to 'http'.

    static_configs:
      - targets: ["localhost:9090"]
  # 메트릭 데이터 URL 경로 정보 추가!!
  - job_name: "spring-actuator"
    metrics_path: '/actuator/prometheus'
    scrape_interval: 1s
    static_configs:
      - targets: ['localhost:8080']
설정파일을 저장하고 다시 터미널에서 ./prometheus로 프로메테우스 서버를 실행하고 프로메테우스 화면을 열어본다.
프로메테우스 화면이 정상적으로 열렸다.
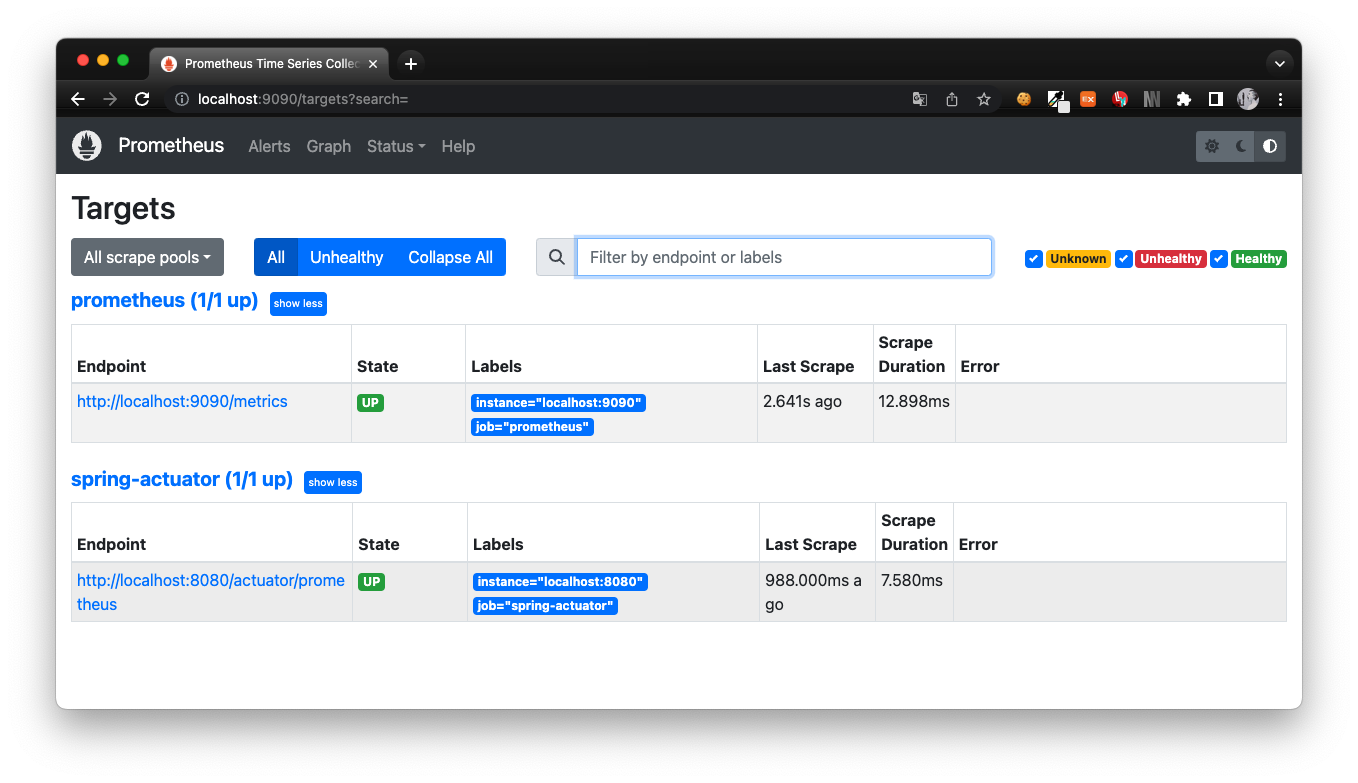
Status > Targets 을 가면 연동상태를 확인할 수 있다. Labels에 spring-actuator가 연동한 대상이다. URL을 보면 prometeus.yml에 설정한 그대로임을 확인할 수 있다. 프로메테우스는 설정대로 1초마다 메트릭데이터를 수집하여 DB에 저장하고 있다. 그럼 DB에 적절한 쿼리를 날려 데이터를 조회해보자.
➤ 쿼리 : http_server_requests_seconds_count{uri="/actuator/prometheus"}
위 쿼리는 /actuator/prometheus 경로에 http request를 요청한 횟수를 조회하는 쿼리이다. 1초마다 프로메테우스가 해당 경로에 접근하고 있으므로 꽤나 많은 횟수가 카운트 되었을 것이다.

쿼리는 1315번 요청이 이루어졌다는 결과가 반환되었다.
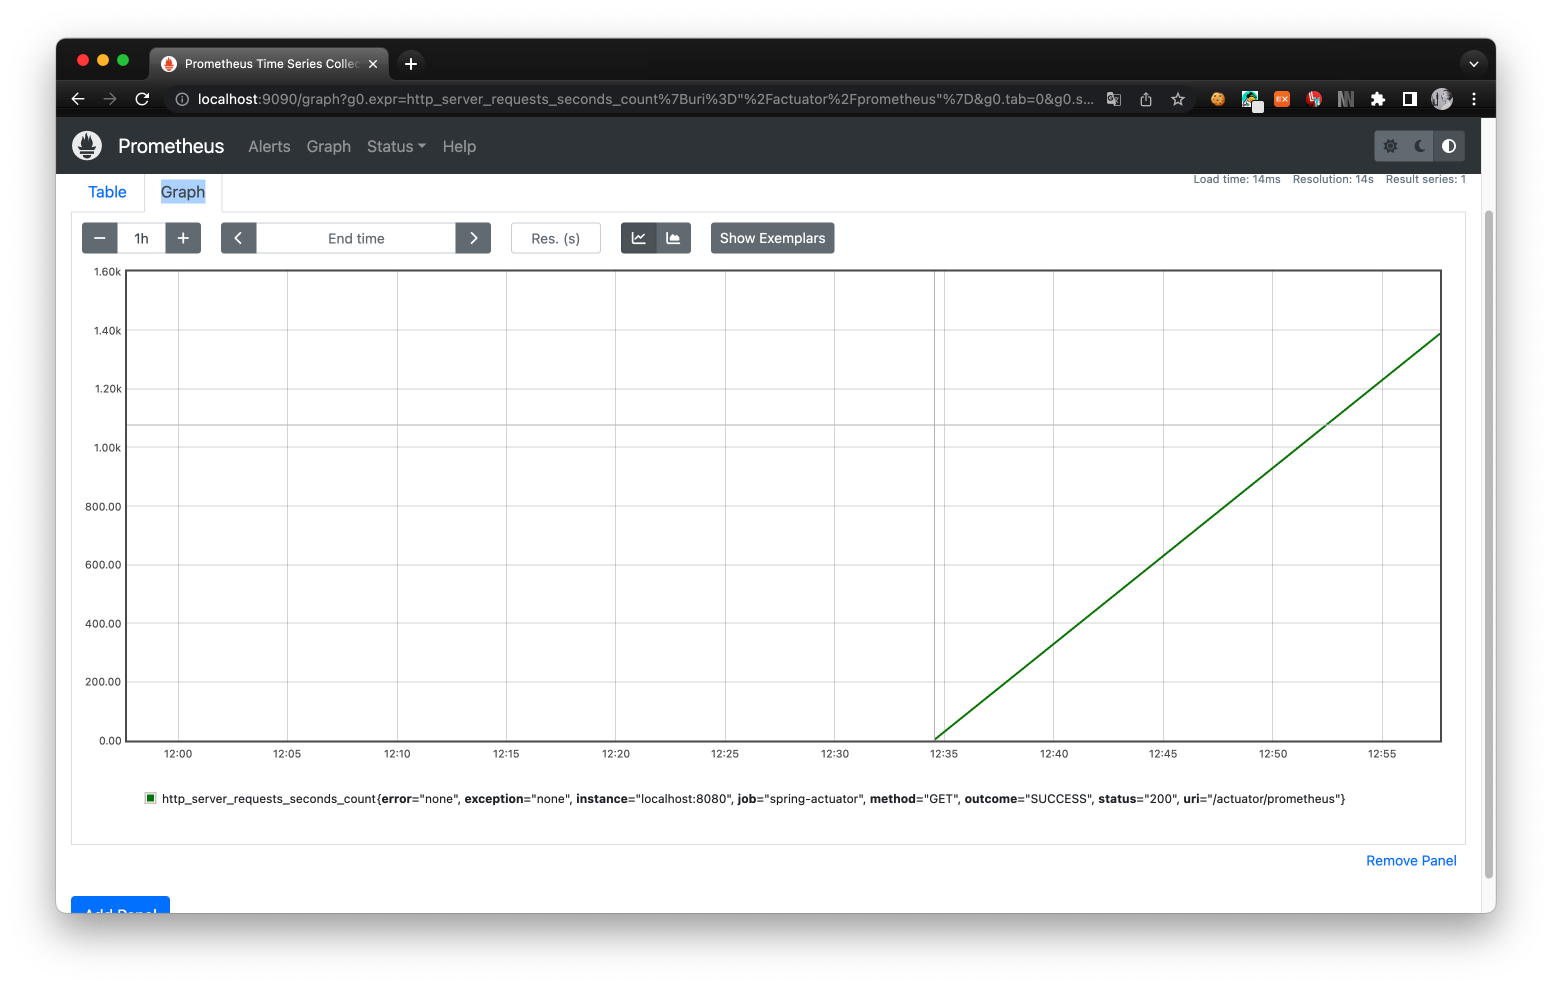
Graph 탭을 누르면 도식화된 형태로 시간별 데이터 추이를 확인할 수 있다.
프로메테우스는 메트릭 데이터를 일정시간 간격으로 수집하여 DB에 저장한다. 그러므로 프로메테우스에 원하는 데이터를 얻기 위해 적절한 쿼리를 만들어 실행하면 시간대별 데이터 추이를 확인 할 수 있다. 이는 Application 모니터링에 중요한 정보이다. 프로메테우스 쿼리문법은 차차 포스팅을 하며 다루어보겠다.

Prometheus는 DB로 데이터를 수집하는데 특화되어 있고 시각화에 특화되어 있지 않다. 시각화에 특화되어 있는 툴에는 Grafana가 있다. Grapana는 Prometheus에 원격으로 쿼리를 날려 데이터를 가져와 시간별 데이터 변화 추이를 시각화한다. Grafana를 이용한 시각화도 차차 다루어보겠다.
참고자료
스프링 부트 - 핵심 원리와 활용 - 인프런 | 강의
실무에 필요한 스프링 부트는 이 강의 하나로 모두 정리해드립니다., - 강의 소개 | 인프런
www.inflearn.com
'Ops > Monitoring' 카테고리의 다른 글
| [Prometheus] Vector와 Scalar란? (0) | 2025.12.17 |
|---|---|
| Prometheus Federation 구현하기 (0) | 2025.09.16 |
| [Grafana] 그라파나 연동하기 ( With SpringBoot, Prometheus ) (1) | 2023.05.13 |